
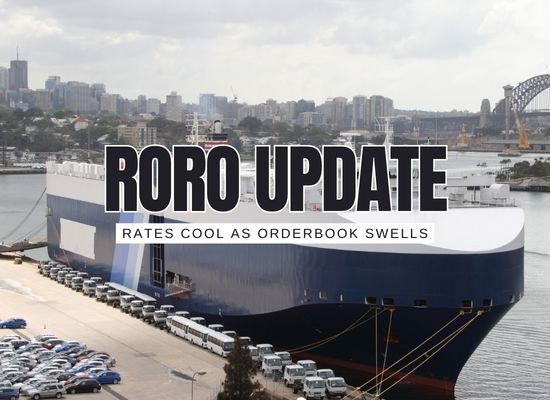

Car-carrier earnings have cooled from the 2023–24 spike just as a record orderbook feeds a delivery bulge through 2026–27. Asian vehicle exports are still propping up volumes, but tariffs and moderating EV demand make this a trickier backdrop. The question now isn’t “boom or bust” it’s how fast we normalize, and which vessel specs keep their premium.
Updated as of Oct 6, 2025. Evidence-based view on rates, the orderbook, policy risk, and what it means for buying, selling, and chartering PCTCs over the next 12–24 months.
1️⃣ What Drove the Boom — and What’s Changed
- Asian export surge: China became the world’s largest car exporter by 2024–25; Korea’s volumes also climbed.
- Underbuilt fleet (then) → big orderbook (now): Owners ordered aggressively, lifting the PCTC orderbook to ~35–40% of fleet and setting up a delivery bulge.
- Policy bite: Higher tariffs on China-built EVs and localization/offshoring moves add routing and demand uncertainty.
- Normalization: 2025 averages are well below the 2023–24 records yet still above long-run trend for prime tonnage.
2️⃣ Rates & Values: From Euphoria to Selectivity
3️⃣ Supply Wave: Deliveries Through 2026–27
- Slippage vs. yard schedules
- Spec tiering (EV/fire safety, deck layouts)
- OEM-controlled tonnage vs. third-party liftings
4️⃣ Demand: Offsetting Forces
- Still-positive export math: Asia (China, Korea) continues to anchor volumes.
- Tariffs & localization: Duties on China-built EVs and regional content rules may reroute flows and compress tonne-miles.
- EV momentum moderates: Sales growth is slower than the 2024 surge; route diversification continues.
5️⃣ Scenarios to Model (2025–27)
6️⃣ Quick Calculator: Charter vs. Buy Breakeven
7️⃣ Action Playbooks
- Favor methanol/ammonia-ready, shore-power-ready tonnage
- Stress-test hires at mid-cycle levels
- Prefer deliveries post-bulge; negotiate yard slippage protections
- Package assets with period cover or extension options
- Show compliance pathways (FuelEU/CII) and EV safety upgrades
- Highlight deck flexibility and route agility
- Push for step-downs/reopeners across delivery windows
- Lock options where green-spec access to ports gives an edge
- Balance multi-year cover with spot exposure as rates normalize
8️⃣ Risk Map
- Tariffs on China-built EVs; possible “price undertaking” deals
- Localization/offshoring that shortens routes
- War-risk/insurance on sensitive corridors
- Delivery bulge → faster re-chartering cycles
- EV/fire-safety retrofits and port compliance bottlenecks
- Tiering by efficiency and deck flexibility
On balance, the car-carrier market looks late-cycle rather than late-stage. Earnings are retreating from extraordinary highs but remain above long-run averages, while the orderbook keeps pressure on forward rates and values. Participants who price deals against mid-cycle hire assumptions, prioritize future-proof specifications, and secure contractual flexibility across the 2026–27 delivery bulge should be positioned to do well whether conditions level off or drift lower from here.