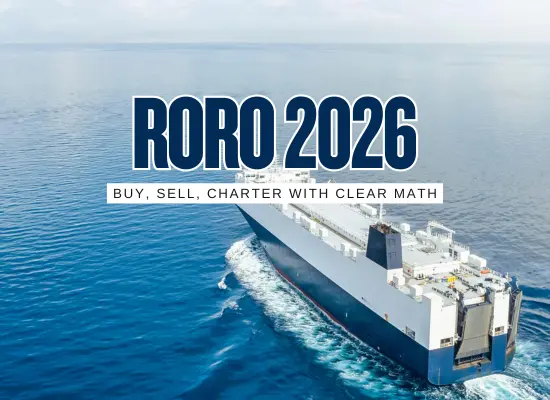

Ro-Ro returns in 2026 will depend on three moving pieces: a delivery bulge of new Large Car-Truck Carriers, still-robust but uneven auto exports out of Asia, and Europe’s carbon rules that turn fuel choices and routing into real cash costs. Below is a clean outlook so buyers, sellers, and charterers can price risk, not guess it.
2026 headline
Ro-Ro rates start the year cooler than 2023–24 peaks as a large orderbook lands. Efficient PCTCs keep a premium. Lane and cargo mix drive most of the spread.
Key swing factors
Asia export volumes, Red Sea routing, Panama flow, and EU carbon costs. These shift voyage time, fuel, and charter floors.
Action in one line
Buy and fix with 2026 supply in mind, document carbon math, and favor CEU-efficient ships with clean port performance.
Market drivers that set the 2026 tone
| Driver | What changed in 2024–25 | 2026 Impact |
|---|---|---|
| Orderbook and fleet growth | Large PCTC delivery wave scheduled into 2026–27. Period benchmarks eased from extreme highs as fresh tonnage met slower lanes. | Base rates softer. Newbuilds with stronger fuel per CEU and design features keep a premium vs older units. |
| Asia export engine | China led global auto exports with a higher NEV share. Tariffs and quotas reshaped destinations and product mix. | Long-haul demand holds but lane mix can whipsaw hire by region and quarter. |
| Red Sea routing | Many strings detoured via the Cape for security. Transit times and fuel per rotation rose. | Longer legs tighten effective supply and can support rates if detours persist. |
| Panama Canal capacity | Slot availability improved from 2024 bottlenecks. Queues eased and schedules normalized. | Less delay premium on Asia–Americas runs. Tighter schedule control expected. |
| EU climate rules | EU ETS steps up to full scope in 2026. FuelEU Maritime in force with GHG intensity targets. | Allowance cost and fuel choice hit net daily returns. Efficient ships and clean documentation trade faster. |
Chartering scenarios
Asia exports stay firm and Red Sea detours persist into peaks. Efficient newbuilds with low fuel per CEU keep tiered premiums.
Neutral to softer vs 2024 peaks. More spread by CEU size and efficiency. Carbon costs priced into EU calls.
Red Sea normalizes quickly, EV tariffs hit volumes, delivery bulge lands on weak demand. Rate pressure broadens beyond older units.
What buyers, sellers, and charterers should do
▶For buyers
- Build cash flows with a delivery bulge haircut. Stress hire at base case plus minus lane swings.
- Value CEU density and fuel per CEU. Credit coatings, trim tools, shaft-gen, and shore-power readiness where ports support it.
- Check cargo mix by lane. Tariffs or quotas can change load factors fast.
▶For sellers
- Package EU ETS and FuelEU math in a simple worksheet. Show voyage fuel, allowances, and penalties avoided.
- Highlight schedule keeping on Cape detours and port turn times with agent confirmations.
- Share verifiable fuel curves after coatings or efficiency retrofits.
▶For charterers
- Structure options around Red Sea and canal constraints. Add triggers for routing changes.
- Use performance clauses tied to CEU-adjusted consumption and weather-aware arrivals.
- Plan carbon exposure on EU calls. Consider pooling or book-and-claim where penalties are steep.
Quick calculators for 2026 decisions
EU ETS exposure per EU voyage
Estimate allowance cost if 100 percent obligation applies in 2026.
Allowance cost: €0
Detour time and fuel cost
Approximate extra days and fuel if routing via the Cape.
Extra days: 0 | Fuel cost: $0
Period rate sensitivity to fuel per CEU
Compare two ships with different consumption and CEU counts.
Fuel per CEU/day: A 0 vs B 0 | Advantage: $0/day
Port turnaround value
Time saved at berth increases annual on-hire days.
Annual value: $0
Coating payback
Fuel saved by premium foul-release coatings between dry docks.
Payback time: 0 months
Buying and selling in 2026
Valuation frame
- Set cash flows on softer base rates than 2024 peaks. Stress with lane swing cases.
- Discount older lower-CEU designs with higher fuel per CEU.
- Give credit for verified efficiency upgrades and shore-power readiness where ports support it.
Liquidity signals
- More listings likely as deliveries rise. Well-documented EU ETS and port performance speed S&P.
- Watch demolition if hires soften. Scrap can set a floor for older units.
- Multi-year cover still clears for top tier, but at moderated talk.
Tariff moves on EVs can swing load factors. Red Sea normalization frees capacity. A weak auto macro lowers voyage counts.
For Ro-Ro in 2026 the base case is a cooler but still functional charter market shaped by a large delivery wave and shifting auto trade lanes. Build your plan around carbon costs on EU calls, possible Red Sea detours, and a wider spread between top-tier and average ships. If your economics rely on yesterday’s peak rates, recheck the math with current fuel, routing, and allowance prices before you commit.